Showing posts with label memory leak. Show all posts

Apr 12, 2010

Case Study on High CPU utilization by Java GUI Based Application

Case Study: Increase in CPU usage for a Multi-Thread Java Application.

Problem Description:

A multi-threaded GUI based Java application running on a Solaris machine caused a significant rise in the CPU usage leading to slowness of the application and occasional hang-ups.

The prstat output is as follows:

PID USERNAME SIZE RSS STATE PRI NICE TIME CPU PROCESS/NLWP

4313 vinay 159M 83M run 0 0 0:15:07 40% vinayview/53

4312 root 22M 19M sleep 59 0 0:02:15 5.1% mmdp/31

4484 vinay 3280K 2840K cpu0 49 0 0:00:00 0.2% prstat/1

Analysis:

  • Usually for a multi-thread GUI java application, the common problem found is the unusual increase in CPU usage and slowness. The default heap size defined for the JVM is usually not enough to run big applications since lots of objects are created and processed. If the allocated heap size is not enough, then Garbage Collector runs continuously to clear the unused objects consuming majority of CPU resource. Hence, tuning the JVM heap size becomes necessary.
  • The rule of thumb is to set same values for both minimum and maximum heap memory but it can be changed as per the requirement of the application.

Solution:

The above problem was solved by increasing the minimum and maximum heap size to 256 MB each as against the default values of 1MB and 64MB respectively. The minimum and maximum values for the heap size are passed as arguments to the VM while creating the executable for the application.

The code snippet is as follows:

// *********************************************************

// ***** IMPORTANT *****

// specify vm_args version # if you use JDK1.1.2 and beyond

// *********************************************************

vm_args.version = JNI_VERSION_1_2 ;

options[0].optionString = cpathoption;

options[1].optionString = vhomeoption;

options[2].optionString = doption;

options[3].optionString = "-Xms256m";

options[4].optionString = "-Xmx256m";

vm_args.options = options;

vm_args.ignoreUnrecognized = JNI_TRUE;

The prstat output after tuning the JVM heap size is as follows:

PID USERNAME SIZE RSS STATE PRI NICE TIME CPU PROCESS/NLWP

4328 vinay 368M 89M sleep 59 0 0:00:14 1.3% vinayview/21

1278 root 16M 13M sleep 59 0 0:43:45 0.3% mmdp/26

1410 root 170M 79M sleep 59 -20 1:10:59 0.1% java/37

4333 vinay 4896K 4552K cpu1 59 0 0:00:00 0.1% prstat/1

Even for running a java applet, the runtime parameters require to be set. Since JVM runs before the execution of the applet so the runtime parameters can be set using the Java Control Panel.

The users who have deployed the latest Jdk will get an option, Java Plug-in node which enables the option to add runtime parameters through applet tag.

References:

Case Study on High CPU utilization by Java GUI Based Application

Case Study: Increase in CPU usage for a Multi-Thread Java Application.

Problem Description:

A multi-threaded GUI based Java application running on a Solaris machine caused a significant rise in the CPU usage leading to slowness of the application and occasional hang-ups.

The prstat output is as follows:

PID USERNAME SIZE RSS STATE PRI NICE TIME CPU PROCESS/NLWP

4313 vinay 159M 83M run 0 0 0:15:07 40% vinayview/53

4312 root 22M 19M sleep 59 0 0:02:15 5.1% mmdp/31

4484 vinay 3280K 2840K cpu0 49 0 0:00:00 0.2% prstat/1

Analysis:

  • Usually for a multi-thread GUI java application, the common problem found is the unusual increase in CPU usage and slowness. The default heap size defined for the JVM is usually not enough to run big applications since lots of objects are created and processed. If the allocated heap size is not enough, then Garbage Collector runs continuously to clear the unused objects consuming majority of CPU resource. Hence, tuning the JVM heap size becomes necessary.
  • The rule of thumb is to set same values for both minimum and maximum heap memory but it can be changed as per the requirement of the application.

Solution:

The above problem was solved by increasing the minimum and maximum heap size to 256 MB each as against the default values of 1MB and 64MB respectively. The minimum and maximum values for the heap size are passed as arguments to the VM while creating the executable for the application.

The code snippet is as follows:

// *********************************************************

// ***** IMPORTANT *****

// specify vm_args version # if you use JDK1.1.2 and beyond

// *********************************************************

vm_args.version = JNI_VERSION_1_2 ;

options[0].optionString = cpathoption;

options[1].optionString = vhomeoption;

options[2].optionString = doption;

options[3].optionString = "-Xms256m";

options[4].optionString = "-Xmx256m";

vm_args.options = options;

vm_args.ignoreUnrecognized = JNI_TRUE;

The prstat output after tuning the JVM heap size is as follows:

PID USERNAME SIZE RSS STATE PRI NICE TIME CPU PROCESS/NLWP

4328 vinay 368M 89M sleep 59 0 0:00:14 1.3% vinayview/21

1278 root 16M 13M sleep 59 0 0:43:45 0.3% mmdp/26

1410 root 170M 79M sleep 59 -20 1:10:59 0.1% java/37

4333 vinay 4896K 4552K cpu1 59 0 0:00:00 0.1% prstat/1

Even for running a java applet, the runtime parameters require to be set. Since JVM runs before the execution of the applet so the runtime parameters can be set using the Java Control Panel.

The users who have deployed the latest Jdk will get an option, Java Plug-in node which enables the option to add runtime parameters through applet tag.

References:

Oct 8, 2009

A Simple Approach to Memory Analysis

Introduction

Memory Leaks are a common error in programming, especially when the language used to write the Code has no in-built automatic garbage collection mechanism. A memory leak can greatly reduce the performance of the system by reducing the amount of available memory especially when the amount of memory available in a system is very limited (in the case of portable systems and embedded applications) and when the program runs for long periods of time (such as background tasks on servers). Due to the prevalence of the memory leak bugs, a number of debugging tools such as IBM Rational Purify, Bounds Checker, memwatch etc. have been developed. Another such tool is User Mode Heap Dump (UMDH). The advantage of using UMDH is that it is very light-weight and fairly all the memory leaks in an application can be traced along with the line number in the source code where the memory has been leaked in a simple and easier way.

The UMDH utility dumps information about the heap allocations of a process and this information include:

· the ‘callstack’ for each allocation,

· the number of allocations that are made through that ‘callstack’, and

· the number of bytes that are consumed through that ‘callstack’.

The UMDH utility also helps compare two UMDH logs to provide an analysis of the difference between them. This information is actually used to check whether there is a memory leak or not.


Pre-requisites for using UMDH

Installing the UMDH Utility:

The UMDH utility is included with the Debugging Tools for Windows. It can be downloaded from the following Web site:

http://www.microsoft.com/whdc/devtools/debugging/installx86.Mspx

After installing the utility, the System PATH environment variable must be set to the location where the UMDH is installed.

clip_image002

Fig. 1: Setting the System PATH Environment Variable

The Windows Symbol Package for Windows XP must be downloaded from the Microsoft Web Site mentioned below and the path where the symbol files are installed must be added to the ‘_NT_SYMBOL_PATH’ environment variable. This has to be done to get the details of the Windows Function Calls in the Stack Trace.

The Windows Symbol package can be downloaded from the Web Site:

http://www.microsoft.com/whdc/DevTools/Debugging/symbolpkg.mspx

clip_image004

Fig. 2: Setting the ‘_NT_SYMBOL_PATH’ Environment Variable

Then, the Global Flags has to be set to enable the creation of the User Mode Stack Trace Database. This is just to let the operating system know that the kernel needs to track the memory allocations made by the application.

For example, if the heap dump is required for ‘Reg.exe’. First, the stack trace acquisition must be enabled for ‘Reg.exe’. By default, this feature is not enabled. The command to enable this feature is:

clip_image005

clip_image007

Fig. 3: Enabling the Stack Traces for ‘Reg.exe’.

Note: The command does not enable stack tracing for processes that are already running. It only enables the stack tracing for all the future executions of ‘Reg.exe’.

The flag can also be set through the ‘GFLAGS’ user interface (run Gflags.exe without any arguments in the command prompt to get the user interface).

clip_image009

Fig. 4: Enabling the Stack Traces for ‘Reg.exe’ from the GUI of ‘Gflags’ Utility.

The -ust option for ‘gflags’ can be used to disable the stack tracing when the debugging is finished.


Using UMDH

After the program is started, the Process ID (PID) of the process must be determined. The PID of the application can be obtained from the output of the ‘tlist’ application or the Task Manager.

The UMHD utility can be used now to get the information regarding the heap allocations of a process.

The Command to be used is:

clip_image010

For Example,

If the Process ID is 2204 and the Output File Name is Log01.log, the command to be given is:

clip_image011

The complete heap dump of the ‘Reg’ Process is now in the ‘Log01.log’ file. This file shows all the allocations that were made and the call stacks where the allocations were made.

The Heap Dump is obtained after each successive execution of the application or after the execution of a particular feature in the application. The subsequent executions must be equivalent. For example, if a certain procedure is followed [Triggering the events in the GUI or running a specific module in the application etc.] during the first execution of the application, the same must be followed in the subsequent execution.

The general principle of operation is that UMDH is typically run two (or more times), once to capture a “baseline” snapshot of the process after it has finished initializing (as there are expected to always be a number of outstanding allocations while the process is running that would not be normally expected to be freed until process exit time.

UMDH is then run again in a special mode that is designed to essentially do a logical “diff” between the “baseline” snapshot and the “leaked” snapshot, filtering out any allocations that were present in both of them and returning a list of new, outstanding allocations, which would generally include any leaked heap blocks. It matches the back traces from each file and calculates the increase in bytes allocated for each back trace. These are then displayed in descending order of size of leak. The first line of each backtrace output shows the size of the leak in bytes, followed by the (last-first) difference in parentheses.

The Syntax for the Comparison is:

umdh File01 File02 > File03

where File01 and File02 are the Log Files obtained in two different times the former at an earlier time and the latter at a later time. File03 is the File where the Comparison Information is to be saved.

For Example,

umdh File01.log File02.log > Comparison.log

The various options that can be used with the UMDH utility are:

-d : to display the Output in Decimal (default is Hexadecimal).

-v : To get the verbose output which includes the actual back traces as well as summary information.

-l : To get the file and line number information or the traces.

Demo:

I used a Win32 Test Application which leaks Memory after each Command Button Click. After enabling the ‘User Mode Stack Trace Database’, I started the application and its Process ID was ‘408.

I clicked the Command Button Once and executed the UMDH Tool to create a baseline snapshot of the heap allocations using the following command:

clip_image012

Then, I clicked the Command Button again and executed the UMDH Tool to create the second snapshot of the Heap Allocations. The Command used was the same as the above except that the Output File Name was changed to ‘Log02.log’.

Note: As each output File is a discrete entity, data is not appended to the end of each file. So, if a batch file is intended to run every ten minutes, we’ll have to ensure that the output file name is different for each snapshot.

After taking the two snapshots of the heap allocation, the UMDH Tool can be used to compare the two files and create an output file. The Command used was:

clip_image013

Each Log Entry in the ‘Diff.log’ has the Following Syntax:

clip_image014

One such Log Entry had the Following Data:

clip_image015

From the above Output, one can infer that Memory was leaked in the Line No. 219 in the ‘TestAppl01.cpp’ File.

The memory leaks are listed in descending order of bytes leaked; each will be followed by the complete stack trace of the allocation call. Depending on the cause, this may either pinpoint the bug / leak, or at least show a good place to set a breakpoint for debugging.

I’ve embedded the Code for the Sample Application and the Logs which were obtained.

clip_image017


Conclusion

UMDH is a fairly simple tool to use and it can very effectively used to pin-point the location of memory leak. All we need to do is to have the Symbol File ( pdb ) of the Application and the Symbol Files of the Windows DLL’s. I’ve included a very simple application as an example just to drive home the idea of using this tool. This tool even can be used to find memory leaks in an application which has a very large code base.


References

1. http://support.microsoft.com/kb/268343

A Simple Approach to Memory Analysis

Introduction

Memory Leaks are a common error in programming, especially when the language used to write the Code has no in-built automatic garbage collection mechanism. A memory leak can greatly reduce the performance of the system by reducing the amount of available memory especially when the amount of memory available in a system is very limited (in the case of portable systems and embedded applications) and when the program runs for long periods of time (such as background tasks on servers). Due to the prevalence of the memory leak bugs, a number of debugging tools such as IBM Rational Purify, Bounds Checker, memwatch etc. have been developed. Another such tool is User Mode Heap Dump (UMDH). The advantage of using UMDH is that it is very light-weight and fairly all the memory leaks in an application can be traced along with the line number in the source code where the memory has been leaked in a simple and easier way.

The UMDH utility dumps information about the heap allocations of a process and this information include:

· the ‘callstack’ for each allocation,

· the number of allocations that are made through that ‘callstack’, and

· the number of bytes that are consumed through that ‘callstack’.

The UMDH utility also helps compare two UMDH logs to provide an analysis of the difference between them. This information is actually used to check whether there is a memory leak or not.


Pre-requisites for using UMDH

Installing the UMDH Utility:

The UMDH utility is included with the Debugging Tools for Windows. It can be downloaded from the following Web site:

http://www.microsoft.com/whdc/devtools/debugging/installx86.Mspx

After installing the utility, the System PATH environment variable must be set to the location where the UMDH is installed.

clip_image002

Fig. 1: Setting the System PATH Environment Variable

The Windows Symbol Package for Windows XP must be downloaded from the Microsoft Web Site mentioned below and the path where the symbol files are installed must be added to the ‘_NT_SYMBOL_PATH’ environment variable. This has to be done to get the details of the Windows Function Calls in the Stack Trace.

The Windows Symbol package can be downloaded from the Web Site:

http://www.microsoft.com/whdc/DevTools/Debugging/symbolpkg.mspx

clip_image004

Fig. 2: Setting the ‘_NT_SYMBOL_PATH’ Environment Variable

Then, the Global Flags has to be set to enable the creation of the User Mode Stack Trace Database. This is just to let the operating system know that the kernel needs to track the memory allocations made by the application.

For example, if the heap dump is required for ‘Reg.exe’. First, the stack trace acquisition must be enabled for ‘Reg.exe’. By default, this feature is not enabled. The command to enable this feature is:

clip_image005

clip_image007

Fig. 3: Enabling the Stack Traces for ‘Reg.exe’.

Note: The command does not enable stack tracing for processes that are already running. It only enables the stack tracing for all the future executions of ‘Reg.exe’.

The flag can also be set through the ‘GFLAGS’ user interface (run Gflags.exe without any arguments in the command prompt to get the user interface).

clip_image009

Fig. 4: Enabling the Stack Traces for ‘Reg.exe’ from the GUI of ‘Gflags’ Utility.

The -ust option for ‘gflags’ can be used to disable the stack tracing when the debugging is finished.


Using UMDH

After the program is started, the Process ID (PID) of the process must be determined. The PID of the application can be obtained from the output of the ‘tlist’ application or the Task Manager.

The UMHD utility can be used now to get the information regarding the heap allocations of a process.

The Command to be used is:

clip_image010

For Example,

If the Process ID is 2204 and the Output File Name is Log01.log, the command to be given is:

clip_image011

The complete heap dump of the ‘Reg’ Process is now in the ‘Log01.log’ file. This file shows all the allocations that were made and the call stacks where the allocations were made.

The Heap Dump is obtained after each successive execution of the application or after the execution of a particular feature in the application. The subsequent executions must be equivalent. For example, if a certain procedure is followed [Triggering the events in the GUI or running a specific module in the application etc.] during the first execution of the application, the same must be followed in the subsequent execution.

The general principle of operation is that UMDH is typically run two (or more times), once to capture a “baseline” snapshot of the process after it has finished initializing (as there are expected to always be a number of outstanding allocations while the process is running that would not be normally expected to be freed until process exit time.

UMDH is then run again in a special mode that is designed to essentially do a logical “diff” between the “baseline” snapshot and the “leaked” snapshot, filtering out any allocations that were present in both of them and returning a list of new, outstanding allocations, which would generally include any leaked heap blocks. It matches the back traces from each file and calculates the increase in bytes allocated for each back trace. These are then displayed in descending order of size of leak. The first line of each backtrace output shows the size of the leak in bytes, followed by the (last-first) difference in parentheses.

The Syntax for the Comparison is:

umdh File01 File02 > File03

where File01 and File02 are the Log Files obtained in two different times the former at an earlier time and the latter at a later time. File03 is the File where the Comparison Information is to be saved.

For Example,

umdh File01.log File02.log > Comparison.log

The various options that can be used with the UMDH utility are:

-d : to display the Output in Decimal (default is Hexadecimal).

-v : To get the verbose output which includes the actual back traces as well as summary information.

-l : To get the file and line number information or the traces.

Demo:

I used a Win32 Test Application which leaks Memory after each Command Button Click. After enabling the ‘User Mode Stack Trace Database’, I started the application and its Process ID was ‘408.

I clicked the Command Button Once and executed the UMDH Tool to create a baseline snapshot of the heap allocations using the following command:

clip_image012

Then, I clicked the Command Button again and executed the UMDH Tool to create the second snapshot of the Heap Allocations. The Command used was the same as the above except that the Output File Name was changed to ‘Log02.log’.

Note: As each output File is a discrete entity, data is not appended to the end of each file. So, if a batch file is intended to run every ten minutes, we’ll have to ensure that the output file name is different for each snapshot.

After taking the two snapshots of the heap allocation, the UMDH Tool can be used to compare the two files and create an output file. The Command used was:

clip_image013

Each Log Entry in the ‘Diff.log’ has the Following Syntax:

clip_image014

One such Log Entry had the Following Data:

clip_image015

From the above Output, one can infer that Memory was leaked in the Line No. 219 in the ‘TestAppl01.cpp’ File.

The memory leaks are listed in descending order of bytes leaked; each will be followed by the complete stack trace of the allocation call. Depending on the cause, this may either pinpoint the bug / leak, or at least show a good place to set a breakpoint for debugging.

I’ve embedded the Code for the Sample Application and the Logs which were obtained.

clip_image017


Conclusion

UMDH is a fairly simple tool to use and it can very effectively used to pin-point the location of memory leak. All we need to do is to have the Symbol File ( pdb ) of the Application and the Symbol Files of the Windows DLL’s. I’ve included a very simple application as an example just to drive home the idea of using this tool. This tool even can be used to find memory leaks in an application which has a very large code base.


References

1. http://support.microsoft.com/kb/268343

Sep 29, 2009

Garbage Collection in IE6

Found this article in http://pupius.co.uk/log/2007-03-07/

Eric Lippert posted about the internals of IE?s garbage collector back in September 2003, though he skimmed over the important bits, which were later noted in the comments. The crux of the problem is that IE?s script engine uses allocations to determine when to run the GC; that is after 256 variable allocations, 4096 array slot allocations, or 64kb of strings have been allocated. Not only are allocations a bad indicator of garbage, but these limits are such that any decent sized application is going to make the GC run pretty regularly.

To compound this problem, the running time of the garbage collection routine is dependent on the size of the working set (O(N^2) as described in Lippert?s article, though the results below show a linear relationship). So as your application gets bigger the garbage collection runs slower.

Back in the day this didn?t really matter, but as web applications are getting more complex there is the potential to hit a performance wall. More code being executed means the garbage collector will be run more frequently; and because the applications contain more state on the client; and have larger code bases, the object graph that the garbage collector has to traverse gets bigger.

To demonstrate the effects of this on performance I?ve used a simple benchmarking function which creates 5000 object literals with random properties, and then sorts them. The function is then run on a simple HTML page, pre-populated with a further O-objects, each with P-properties, which will always remain in scope.

The following results show the mean execution time of the create-and-sort test as O increases for constant P=50 on Firefox 2.0 (red) and IE6 (blue) on the same computer.

gc_graph

Try the test for yourself.

Now, the test environment is quite contrived in that it creates the literals as homogeneous global variables in a simple scope, but the effects are the same if you create objects dynamically, with scope chains exposed via event handlers and closures.


I doubt there are many web applications that are big enough to be seriously impacted by these problems, though it is worth bearing in mind, since performance is proven to be strongly linked to adoption of web apps.

Microsoft issued a hot fix that allows you to increase the allocations, this gives a significant performance boost, but you don?t want to force all your users to patch IE so this isn?t a viable solution. IE7 seems to have solved this problem by having dynamic allocation thresholds that scale to the size of your application, but rollout of IE7, particularly to corporate users, is likely to be slow for the rest of 2007. The other options can be painful and basically involve optimizing your application by reducing code size and finding the balancing point between improved performance from keeping state local and keeping your working set to a manageable size. Always explicitly dispose objects when they are no longer needed by removing event handlers and dereferencing properties.

References:

Eric Lippert?s 2003 post: “How Do The Script Garbage Collectors Work”
http://blogs.msdn.com/ericlippert/archive/2003/09/17/53038.aspx


Micrsoft Support Article: “You may experience slow performance when you view a web page that uses Jscript in Internet Explorer 6”
http://support.microsoft.com/kb/919237

Garbage Collection in IE6

Found this article in http://pupius.co.uk/log/2007-03-07/

Eric Lippert posted about the internals of IE?s garbage collector back in September 2003, though he skimmed over the important bits, which were later noted in the comments. The crux of the problem is that IE?s script engine uses allocations to determine when to run the GC; that is after 256 variable allocations, 4096 array slot allocations, or 64kb of strings have been allocated. Not only are allocations a bad indicator of garbage, but these limits are such that any decent sized application is going to make the GC run pretty regularly.

To compound this problem, the running time of the garbage collection routine is dependent on the size of the working set (O(N^2) as described in Lippert?s article, though the results below show a linear relationship). So as your application gets bigger the garbage collection runs slower.

Back in the day this didn?t really matter, but as web applications are getting more complex there is the potential to hit a performance wall. More code being executed means the garbage collector will be run more frequently; and because the applications contain more state on the client; and have larger code bases, the object graph that the garbage collector has to traverse gets bigger.

To demonstrate the effects of this on performance I?ve used a simple benchmarking function which creates 5000 object literals with random properties, and then sorts them. The function is then run on a simple HTML page, pre-populated with a further O-objects, each with P-properties, which will always remain in scope.

The following results show the mean execution time of the create-and-sort test as O increases for constant P=50 on Firefox 2.0 (red) and IE6 (blue) on the same computer.

gc_graph

Try the test for yourself.

Now, the test environment is quite contrived in that it creates the literals as homogeneous global variables in a simple scope, but the effects are the same if you create objects dynamically, with scope chains exposed via event handlers and closures.


I doubt there are many web applications that are big enough to be seriously impacted by these problems, though it is worth bearing in mind, since performance is proven to be strongly linked to adoption of web apps.

Microsoft issued a hot fix that allows you to increase the allocations, this gives a significant performance boost, but you don?t want to force all your users to patch IE so this isn?t a viable solution. IE7 seems to have solved this problem by having dynamic allocation thresholds that scale to the size of your application, but rollout of IE7, particularly to corporate users, is likely to be slow for the rest of 2007. The other options can be painful and basically involve optimizing your application by reducing code size and finding the balancing point between improved performance from keeping state local and keeping your working set to a manageable size. Always explicitly dispose objects when they are no longer needed by removing event handlers and dereferencing properties.

References:

Eric Lippert?s 2003 post: “How Do The Script Garbage Collectors Work”
http://blogs.msdn.com/ericlippert/archive/2003/09/17/53038.aspx


Micrsoft Support Article: “You may experience slow performance when you view a web page that uses Jscript in Internet Explorer 6”
http://support.microsoft.com/kb/919237

Sep 25, 2009

Memory Leak Articles – Very useful!


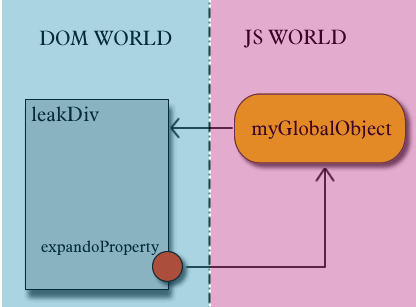
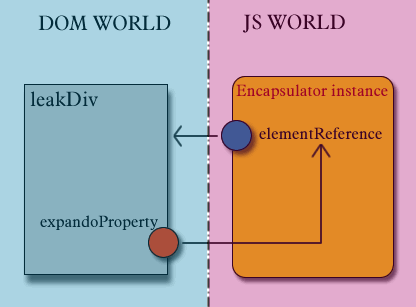
DOM Events, Memory Leaks, and You

Joel Webber, Google Web Toolkit Team
Updated January 2009
Source


Javascript Closures

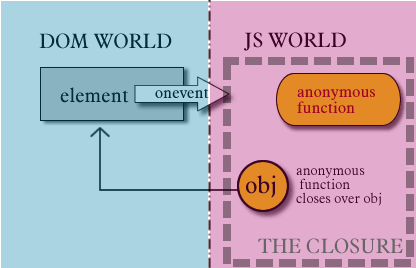
Closure
A "closure" is an expression (typically a function) that can have free variables together with an environment that binds those variables (that "closes" the expression).


DHTML leaks like a sieve

Source


Memory leak patterns in JavaScript

https://www.ibm.com/developerworks/web/library/wa-memleak/


JavaScript and the Document Object Model

http://www.ibm.com/developerworks/web/library/wa-jsdom/


Memory Leakage in Internet Explorer - revisited

Source


Leak Free Javascript Closures

http://laurens.vd.oever.nl/weblog/items2005/closures/


Memory Leak Articles – Very useful!


DOM Events, Memory Leaks, and You

Joel Webber, Google Web Toolkit Team
Updated January 2009
Source


Javascript Closures

Closure
A "closure" is an expression (typically a function) that can have free variables together with an environment that binds those variables (that "closes" the expression).


DHTML leaks like a sieve

Source


Memory leak patterns in JavaScript

https://www.ibm.com/developerworks/web/library/wa-memleak/


JavaScript and the Document Object Model

http://www.ibm.com/developerworks/web/library/wa-jsdom/


Memory Leakage in Internet Explorer - revisited

Source


Leak Free Javascript Closures

http://laurens.vd.oever.nl/weblog/items2005/closures/


Text Widget

Copyright © Vinay's Blog | Powered by Blogger

Design by | Blogger Theme by